We hit 300,000 followers on LinkedIn! It’s a milestone we’re incredibly grateful for. Thank you…
5 More Graphic Organizers for Online Learning (Part 2)
Last week, we introduced five graphic organizers you can use with your online students to help them consolidate what they’ve learned. Each graphic organizer serves a unique purpose, whether it’s organizing ideas, making connections, or summarizing key points. These flexible tools for different types of assignments are invaluable to your students’ learning.
This week, we’ll take a look at five more graphic organizers to further expand your students’ toolbox. These additional templates will help them structure their thoughts, plan effectively, and reflect more deeply on new concepts.
6) T-chart
A T-chart uses two columns that organize information into two categories, such as when comparing advantages and disadvantages or facts and opinions.
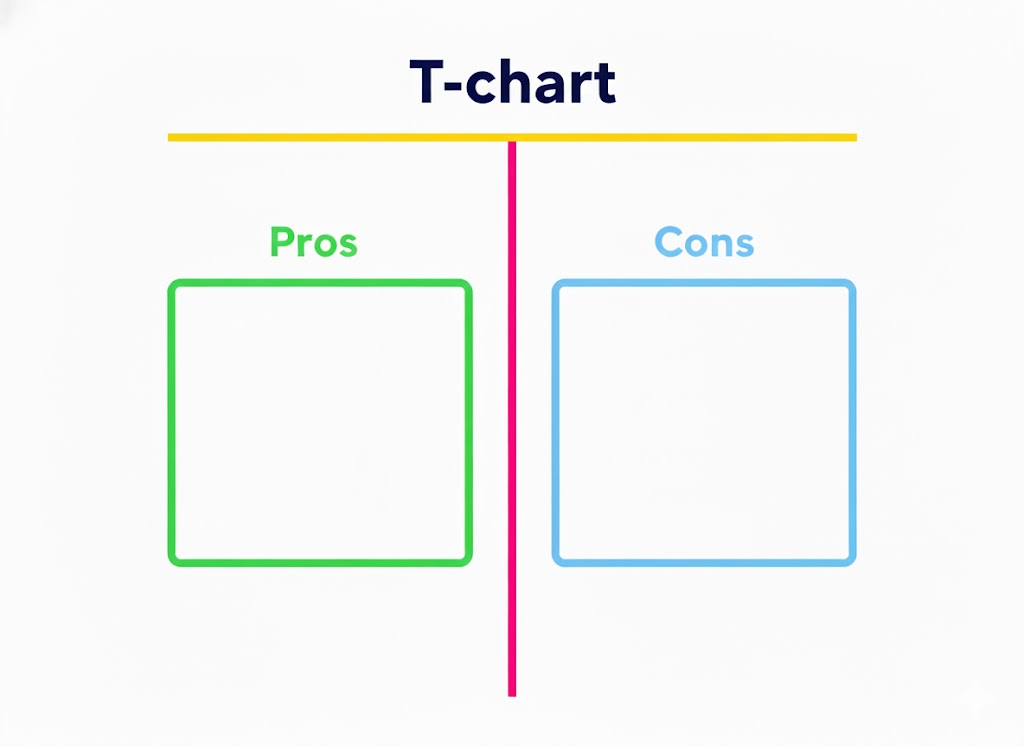
When to Use:
- To evaluate the pros and cons before making a decision.
- To sort information into contrasting categories.
- To compare viewpoints or arguments.
7) Flowchart
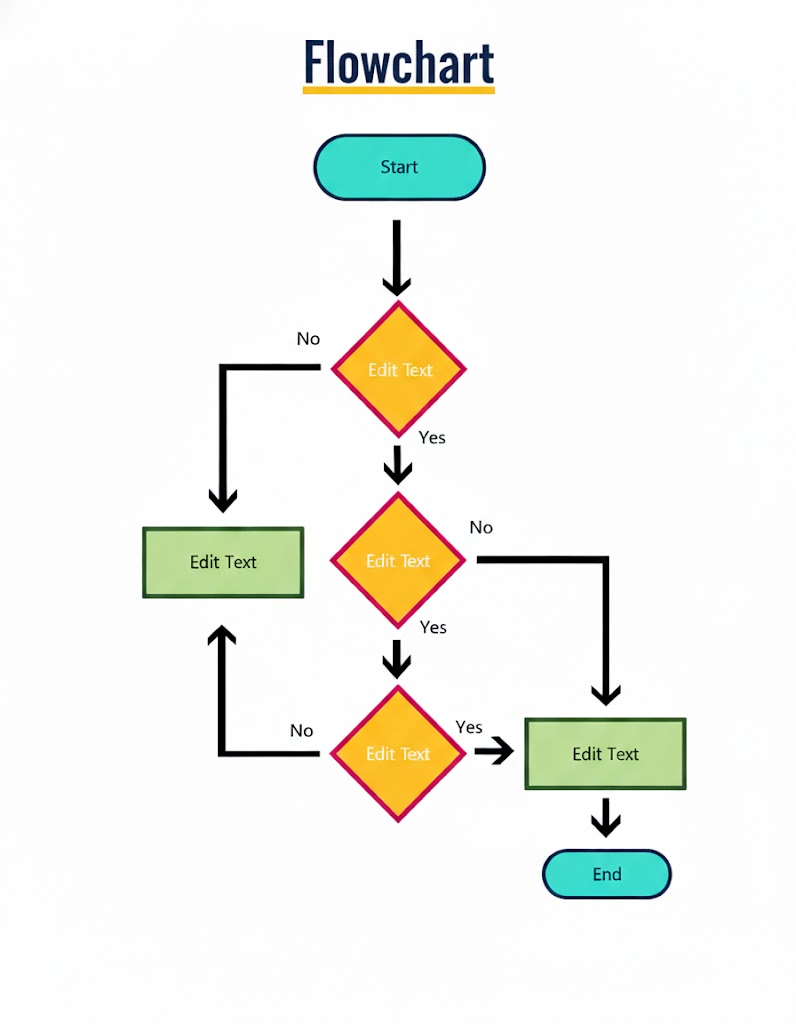
A flowchart is a step-by-step diagram showing processes or sequences. Each box represents a stage and arrows show the direction or order to proceed.
When to Use:
- To outline procedures (e.g. steps in the water cycle, the scientific method).
- To plan or explain a process (e.g. solving a complex mathematical equation).
- When learning computer algorithms or other types of instructions.
8) Concept map
A concept map is a structured diagram that shows hierarchical relationships between ideas. Concepts are linked with connecting words, like causes, leads to, is part of, etc.
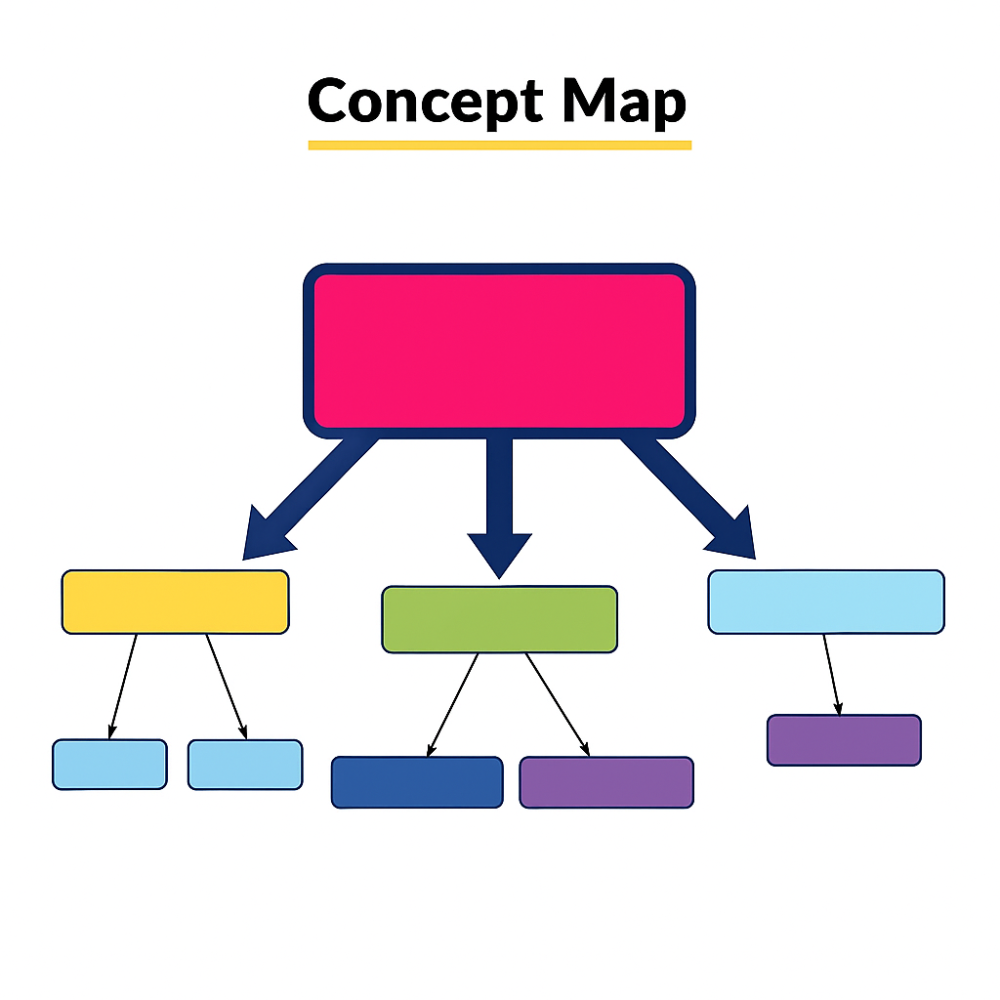
When to Use:
- To show cause-and-effect relationships in science or history.
- To organize complex systems or theories.
- To summarize information from readings or lessons.
9) Persuasion map
A persuasion map helps plan and organize arguments for persuasive writing or debates. It starts with a main claim or opinion, followed by three supporting reasons (each backed with evidence or examples), and ends with a strong conclusion.
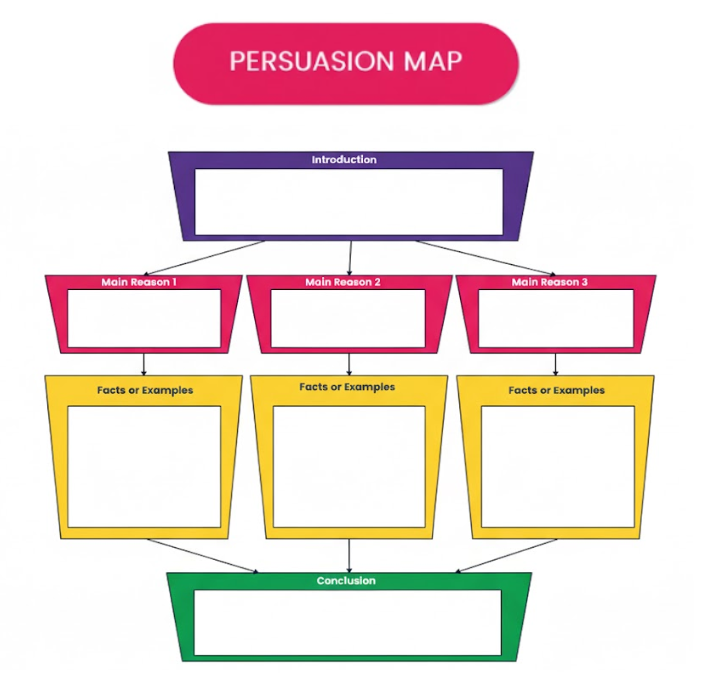
When to Use:
- In English or social study classes for persuasive essays, opinion writing, or debates.
- To help students structure logical arguments and back them up with evidence/examples.
- When teaching critical thinking and reasoning.
10) Story map
A story map is also called a sequence chart. It organizes events or steps in order, often with the beginning, middle, and end labelled.
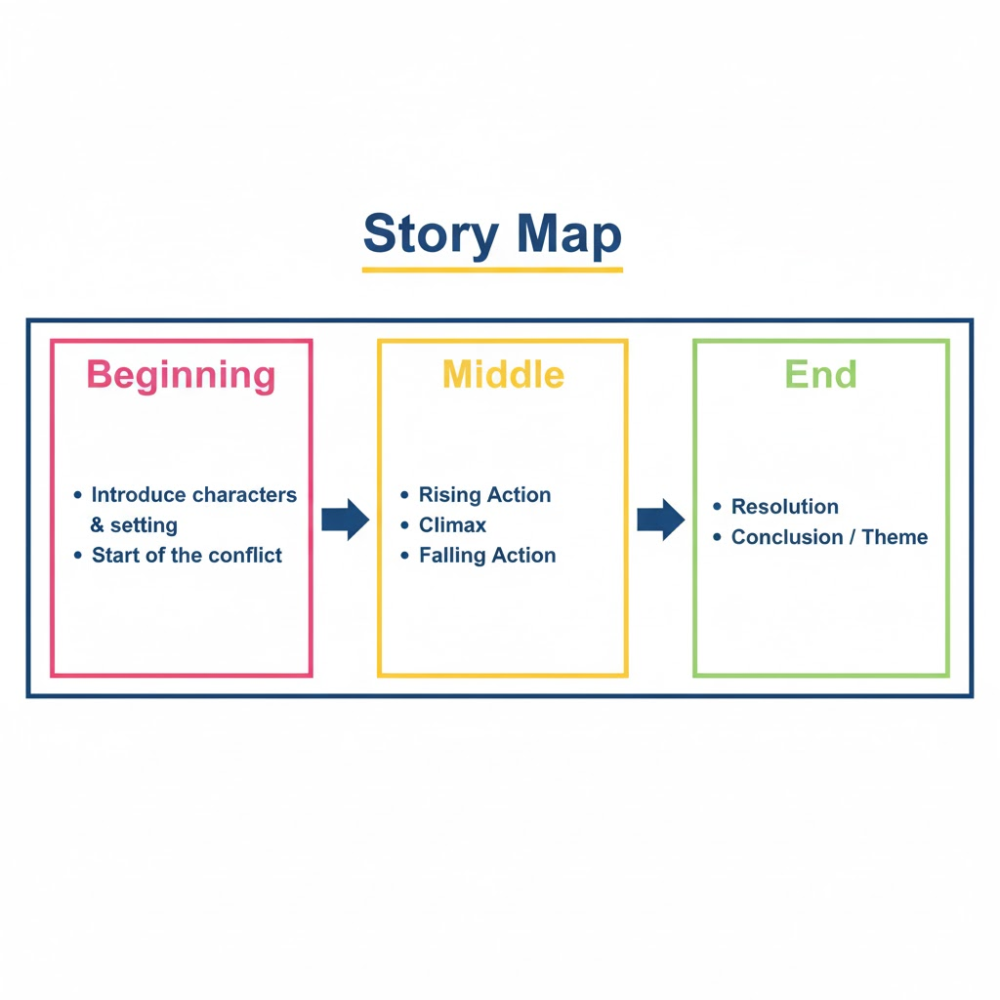
When to Use:
- To summarize story plots or narratives.
- To outline steps in experiments or processes.
- To reinforce logical order in writing.
We hope you found these two articles about graphic organizers helpful and will incorporate them in your online classes. What’s your favorite graphic organizer? Share it in the comments below!
Related Posts